Plot free recall accuracy in an existing ax object
This example plots free recall accuracy in an existing Matplotlib Axes object.
[1]:
# Code source: Contextual Dynamics Laboratory
# License: MIT
#import
import quail
import matplotlib.pyplot as plt
#load data
egg = quail.load('example')
#analysis
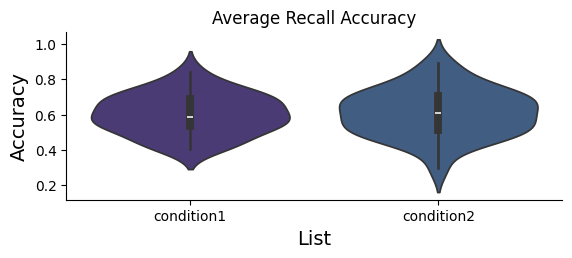
fegg = egg.analyze('accuracy', listgroup=['condition1']*4+['condition2']*4)
#plot by list
fig = plt.figure()
ax = fig.add_subplot(2,1,1)
fegg.plot(plot_style='violin', title='Average Recall Accuracy', ax=ax)
[1]:
<Axes: title={'center': 'Average Recall Accuracy'}, xlabel='List', ylabel='Accuracy'>