Plot serial position curve
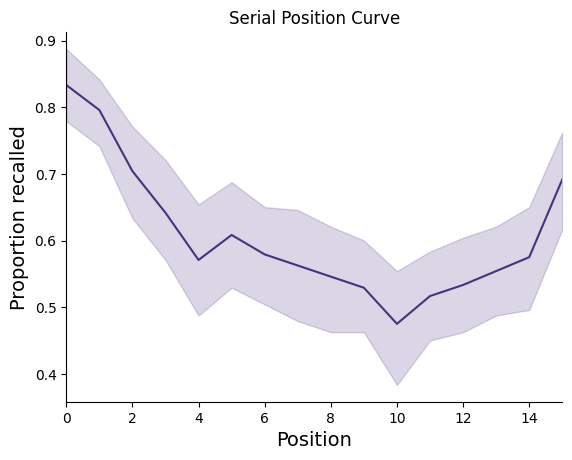
This example plots the probability of recall success as a function of serial position during stimulus encoding.
[1]:
# Code source: Contextual Dynamics Laboratory
# License: MIT

# import
import quail

#load data
egg = quail.load('example')

# analyze and plot
fegg = egg.analyze('spc', listgroup=['average']*8)

fegg.plot(title='Serial Position Curve')
[1]:
<Axes: title={'center': 'Serial Position Curve'}, xlabel='Position', ylabel='Proportion recalled'>