Plot Lag-CRP
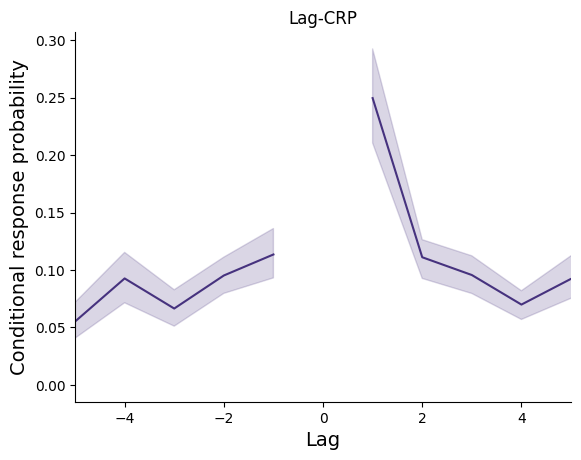
This example plots a Lag-CRP as described in Kahana et al (1996). Given the recall of a stimulus in position n, this plot shows the probability of recalling stimuli in neighboring stimulus positions (n+/-5).
[1]:
# Code source: Contextual Dynamics Laboratory
# License: MIT

# import
import quail

# load data
egg = quail.load('example')

# analyze and plot
fegg = egg.analyze('lagcrp', listgroup=['average']*8)

fegg.plot(title='Lag-CRP')
[1]:
<Axes: title={'center': 'Lag-CRP'}, xlabel='Lag', ylabel='Conditional response probability'>